
Taimoor Muhammad
Data SCientist
Data Scientist with four years of experience in developing data pipelines, machine learning algorithms, and conducting data analysis, specializing in consumer analytics and ETL development.


Data Analysis

Team Management

Programming
Profile

Areas of Interest


Machine Learning
Cloud Computing

Data Visualization

ETL Development

Music

Cooking


Content Writing

Model Deployment

Working Out

Education
- BS. Electrical Engineering, Lahore University of Management Sciences
- MS. Applied Data Analytics, Boston University
I've worked for

LUMS

Data Science Dojo

Boston University
Published Projects
Take a look at my recent work
Building an End-to-End Data Warehouse Pipeline
Python, SQL, Snowflake, MongoDB, Tableau
Constructed a comprehensive end-to-end data warehouse, unraveling the intricacies from importing raw data to visualizing insights.
Health Insurance Plan Prediction
Python
Developed an algorithm for suggesting the most suitable health insurance plans in the user’s area.
Link
Predicting the Environmental Impact of Vehicles
R
Developed a predictive model to determine the impact of vehicles on CO2 emissions and smog ratings.
Exploratory Data Analysis (EDA) with Python
Python
Discussed the importance of EDA in understanding customer churn, the techniques used, and how to apply them to a customer churn dataset.
Biomedical Signal Estimation
Python
Designed an algorithm for estimating biomedical signals using CNN-LSTM-ResNET-UNet algorithms.
Recommendation System
Python
Built a recommendation system using Python libraries later to execute web scrapping and text transformation.
Dashboards
Tableau
Analysis
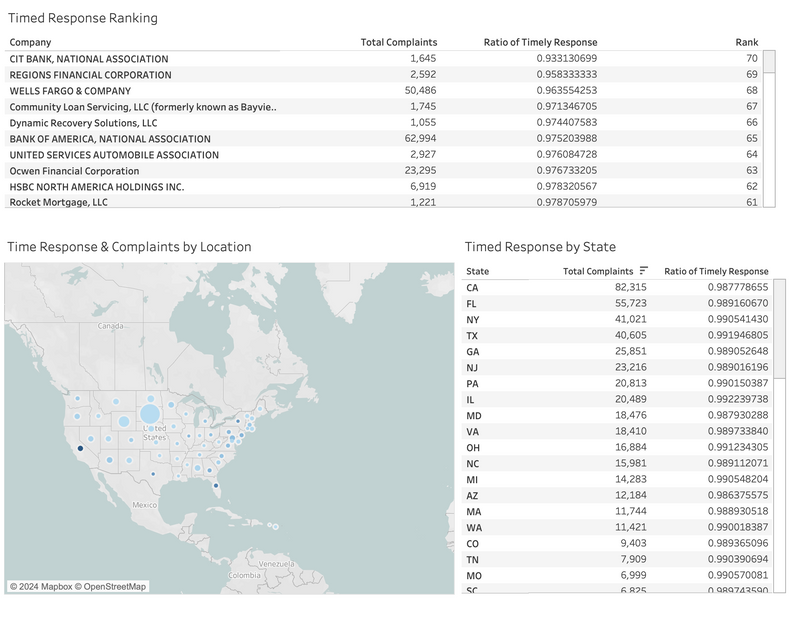
For the companies with the worst timely response ratio. Find areas that can be targeted to improve performance.
To answer this question, I created a dashboard using a combination of tree visuals. This visualization aims to highlight my ability to create measures and calculated fields in Tableau.
Timed Response Ranking by Company
This visual calculates the timely response ratio of each company and assigns a rank based on that. From the entire dataset, only companies with complaints higher than 1000 were taken in order to make the analysis roughly more significant.
Timed Response by State
To further dive deep, this visual calculates the time response and cases for each state.
Timed Response & Cases by Location
Although this is a carry on from the previous graph, when put in this form, this visuals helps me build an understanding of how company performances might be realted to regions.
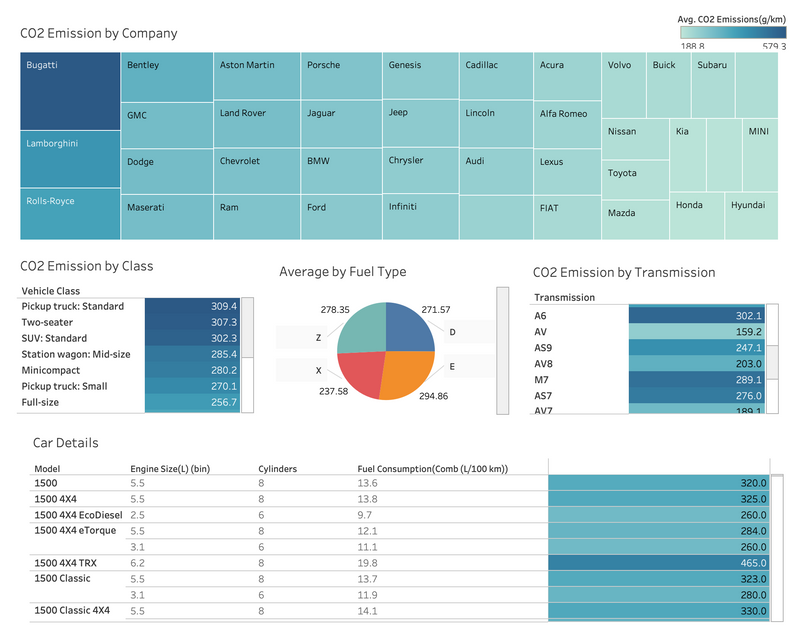
Analysis
Filter out companies and models with the highest amount of carbon emissions.
For this purpose, I used a combination of 5 visualizations that outline companies, models, and average stats for categorical variables.
CO2 Emissions by Company
This visualization outlines the average co2 emission of ecah company and ranks them in order by using a highlight table.
CO2 Emissions by Class and Transmission
Using a text tables, I have outlined the average co2 emissions by class and transmissions. This will help policy makers build an understanding (transforming complex information into simple terms) of which class or transmission to focus on when decding how to reduce carbon emissions in a model or when designing a new model.
Average by Fuel Type
Using a pie chart, I have highlighted how different types of fuel contribute to carbon emissions.
Car Details
Finally, I have added another text table that gives out relevant information of the car to help people understand the components of each car and where to focus on when performing a statistical analysis.
Contact
mtaimoor@bu.edu
Phone
512-639-5101
Socials